CRM Charts are a collection of data in a pictorial representation which gives a clear cut idea of the business growth or loss, analysing the business functions and help in making plans for future improvement. Business charts helps to gain real time insights.
Some of the highlighting points of uses of CRM Charts are:
- It can help in comparing the revenue earned during specific duration or time
- It helps in knowing the sales growth over the time
- You can understand which source helps in bringing more deals
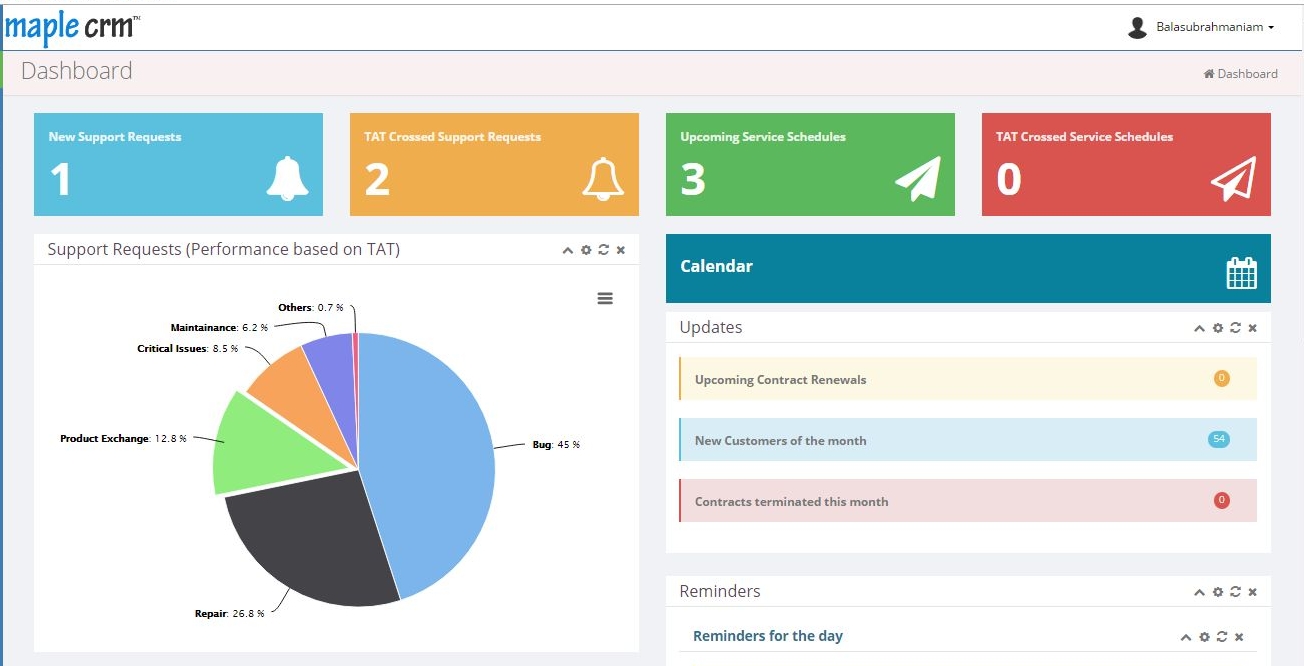
Maple provides extensive charting capabilities thus helping the users to analyze their data quickly and effectively. It provides quick and easy overview of current business performance using charts. Maple’s Account Trend analysis charts helps in understanding your business growth easily. Also, one more charting feature called Account Churn Analysis Charts is to be released soon!! Maple’s team is really working hard to implement more and more useful features. 🙂


